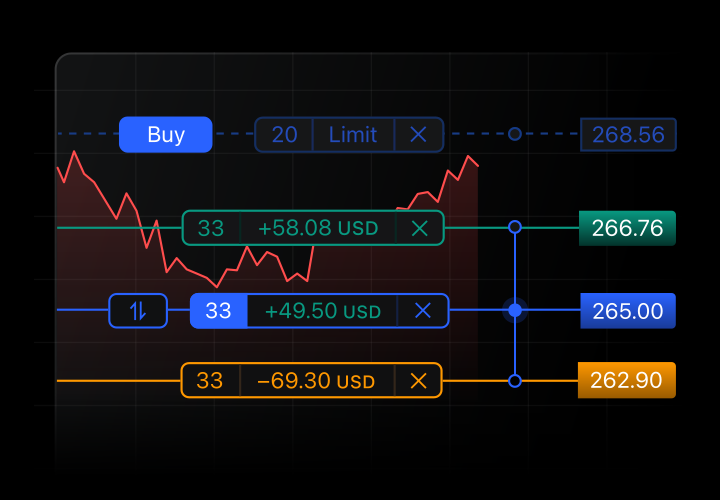
Advanced Chart Workspace for Price, Volume and Indicators
The chart workspace brings price movement, volume, indicators, overlays, alerts and drawings into one view. Traders can zoom into recent volatility, review historical structure, stack indicators, compare signals and keep technical notes attached to the chart instead of separating research across tools.
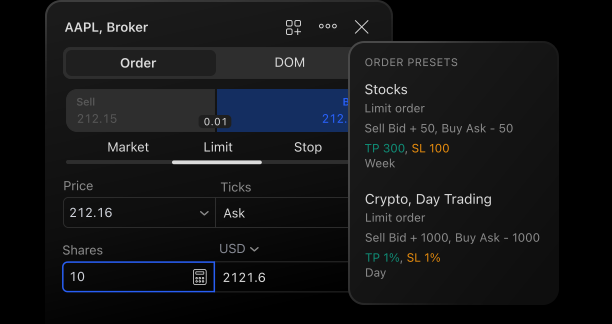
Symbol Search for the Right Market and Exchange
Symbol search helps users find the correct asset before analysis starts. Search by ticker, company name, pair, contract, exchange or asset class to open stocks, forex pairs, cryptocurrencies, futures, indices and macro data. Exchange labels reduce ticker confusion, while watchlists keep related markets organized.
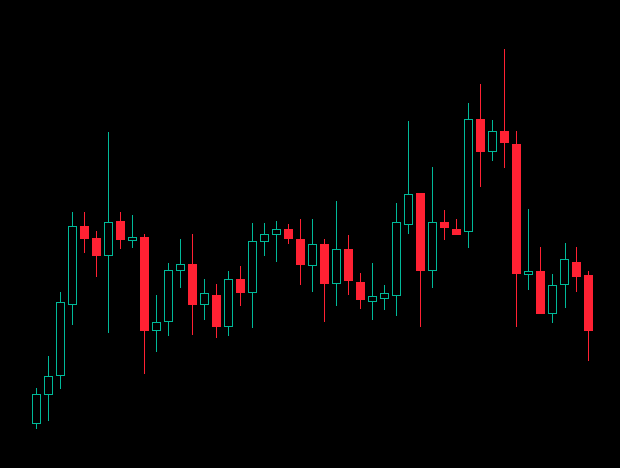
Chart Types and Timeframes for Technical Analysis
Chart type controls how price action is displayed. Timeframe controls how much market activity each bar represents. Candles, lines, areas, hollow candles and structure-based charts help reveal different patterns, while intraday and higher timeframes support different trading and research styles.
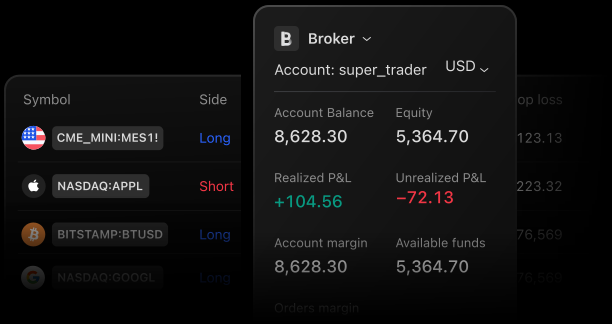
Multi-Chart Layouts for Cross-Market Comparison
Multi-chart layouts make it easier to compare markets without losing context. Keep an index beside leading stocks, compare crypto pairs across exchanges, view one asset on multiple timeframes, or monitor forex and commodities together. Synchronized cursors and saved layouts support consistent research sessions.
Drawing Tools for Levels, Patterns and Review
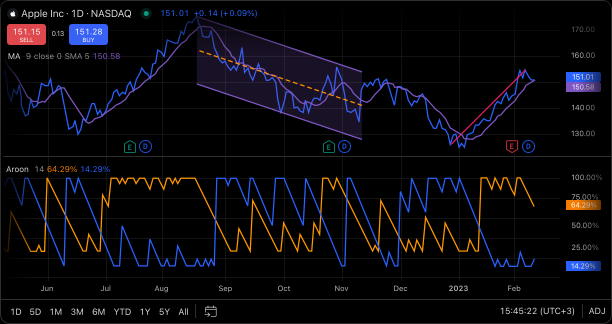
Drawing tools help turn observations into clear chart records. Use trendlines, support and resistance, channels, ranges, Fibonacci tools, measurements and text notes to mark structure. Snapping, locking and reusable styles keep chart markup consistent across future reviews.